government

Research Basics: NAICS

naics_collage.jpg

There’s nothing like an impending election to make our government look bad, but on occasion they get things right, like data production.  Point in case the NAICS Code, which stands for North American Industry Classification Scheme.  In business research NAICS Codes are a handy-dandy tool for 1) isolating industry news/reports, and 2) creating company lists based on, as the title implies, how a business is classified. You can include the NAICS Code as piece of limiting criteria in some of our favorite databases like Business Source Complete, and ReferenceUSA.  In the first screenshot shown below, the NAICS option comes up in a dropdown list in BSC. 

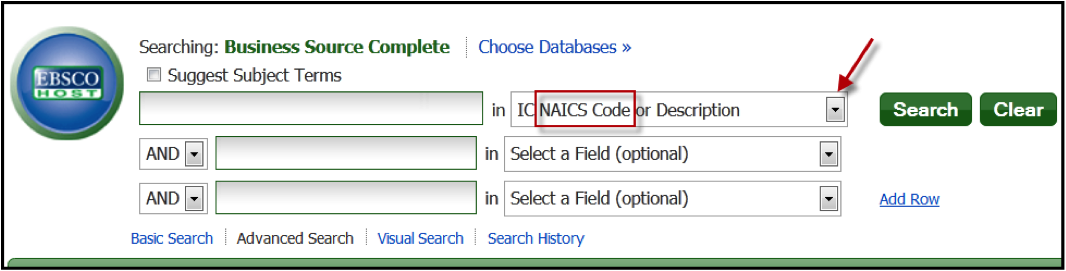
Also because NAICS falls under the umbrella of all-things-Census, you’ll also see it featured on the Industry Statistics Sampler website.  Just choose your code of interest to see downloadable report offerings for how that industry is faring.

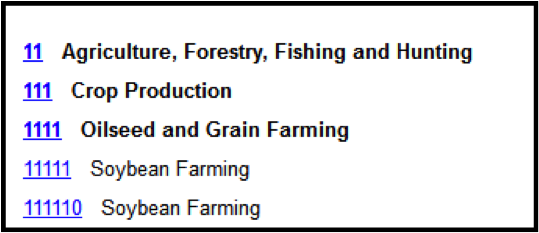
How do you get your hands on the code you need?  Visit the NAICS homepage and use the search box above the “2007 NAICS Search” button to enter a word, e.g. “sunglasses,” and you’ll receive a list of codes related to your term.  The image on the right shows the extent to which you can drill down using the NAICS website.  Click on a code to see even more information about how it's used to make sure you’re on the right track.

One important note is that some databases and business tools might still reference SIC (Standard Industry Classification) Codes, which were last updated in 1987, and which NAICS replaced in 1997 (FAQ).  For the fine points of difference between SIC and NAICS, visit its History page.  On the off-chance you need to translate between these codes, visit the Concordances page.

The CDC Under Magnification: Part Two

NCHS_Logos.png

Wouldn’t you know, watching the very smart movie Contagion last night would get me psyched to write this second installment on the CDC?  This part deals with the National Center for Health Statistics, a CDC subset that works to, “compile statistical information to guide actions and policies to improve the health of our people. …Working with partners throughout the health community, we use a variety of approaches to efficiently obtain information from the sources most able to provide information” (About). For someone trying to do business research through the NCHS website for the first time, be forewarned that these pages, understandably dense with information, have a nearly overwhelming barrage of links, terminology, and acronyms-that-all-sound-the-same.  My advice is to acclimate to the site’s organization by starting at the beginning:  use the left-side navigation menu to peruse the NCHS’s various Surveys and Data Collection Systems’s sub-pages on an individual basis to see which one might offer information that’s relevant to your research.  If a particular survey sounds promising, then also stick to that left-menu’s Survey Results & Products link, or any comparable link, when they're available.

In this manner, I managed to drill down to a site that breaks the National Hospital Discharge Survey, one of the  more exhaustive surveys, into spreadsheets of information based on popular aggregating factors.  (Alas, I don't know if this url and my last link are persistent).  For example, I downloaded a chart that gives me totals for “all listed procedures” from hospitals by category and age, meaning I see things like the number of appendectomies performed in the 15-44 age group.  This type of information is great for those trying to compile a numerical justification for their newfangled product or pill.

The CDC Under Magnification: Part One

Screen-shot-2012-02-23-at-4.49.22-AM.png

We’re lucky to live in a country where our government collects and disseminate scads of information for free, case in point, the Centers for Disease Control and Prevention.  Of course nothing is easy with our government, and the CDC website is no exception, mostly due to its sheer scale.  So, having nothing better to do, being kind and selfless, I decided to spend some quality time frolicking through the CDC.gov realm in order to point out a couple highlights that are relevant to business researchers. First and foremost, the Features -> Data & Statistics Page lends itself particularly well to background and/or market validation types of research.  It has been going strong since 2007, and it covers a surprisingly wide array of topics concerning our health.  Interested in opening up a recovery center?  Check out the 2011 Painkiller Overdoses report.  Selling hearing aids?  Read the 2010 or 2011 Infant Hearing Loss report.   Manufacturing air conditioners?  See the 2009 Working in Hot Environments report.

These reports are presented in a format akin to the brief executive summary, with a sprinkling of impactful charts scattered among a handful of paragraphs (including citations).  The bottom of the reports will also feature a series of links to related resources that might, depending on the institution, freely provide their own information too.

NCES - Education Statistics

NCES.jpg

The National Center for Education Statistics (NCES), analyzes and provides data on education. NCES is run by the U.S. Department of Education Institute of Education Sciences. There are more education stats here than you can imagine. You can find school district demographics, drop-out rates, early education, adult literacy, school locators, and even international education comparisons. There are published reports or you can create custom tables. Some examples of stats available:

  • Medium income for High School grads is $25,000 and for Bachelor's degree or higher it's $45,000
  • 1.5 million kids were home schooled in 2007
  • The most popular major is business with 335,000 degrees conferred
  • Educational systems that outperformed the US in 4th grade science were Chinese Taipei, Hong Kong SAR, Japan, and Singapore
  • 57% of children ages 3 to 5 and not yet enrolled in kindergarten were enrolled in a center-based program

NCES Custom Table