

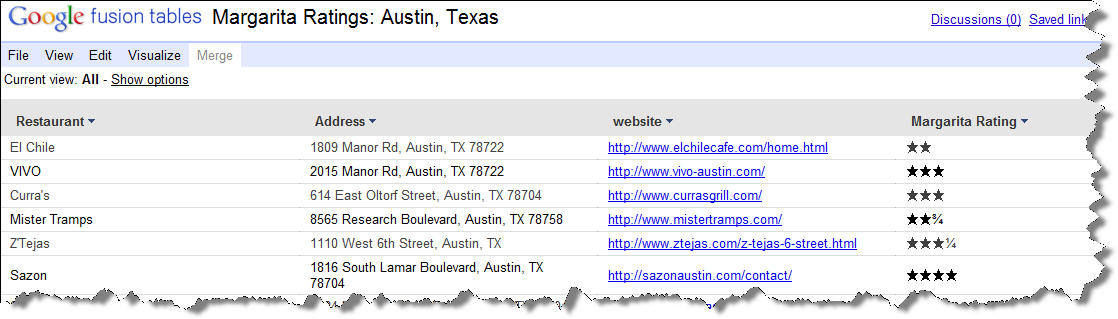
Amy Rushing, Metadata Librarian extraordinaire, shows bizologie how to put Google Fusion Tables to good use. Amy has spent two years testing margaritas around Austin and rating them. Using Google Fusion she has given us Margarita Ratings: Austin, Texas - a map of restaurants and their margarita rating. You can see her rating scale in the File>About section of the Table. With Google Fusion you can create charts, graphs, and all sorts of different visualizations including maps. And, you don't have to be a metadata librarian to do it. It's easy. To create a map, make a spreadsheet with the data in Excel or Google Docs. One of the columns has to be address with zip code to map the locations. Amy used HTML code to create to the stars and fractions for her ratings. Then just import the spreadsheet into Google Fusion.

Let us know if you are inspired to use Google Fusion to map your passion. We'd love to see your masterpiece. And, Amy, we here at bizologie commend you and hope you continue your good work.