spending

University Presidents' Salaries

mortarboard_currency.jpg

When we think of the phrase executive compensation, the first thing that probably comes to mind is all things banking and corporate.  Hence it's englightening to see the data compendium that one of the major trade-pubs for our nonprofit industry, The Chronicle of Higher Education, created when they trained a spotlight on the biggest fish in their university ponds- the presidents. We give them kudos for the sheer volume of research work.  They found out how much these .edu CEOs make, plus how that salary compares to the average professor's compensation for that institution, plus what percentage that salary is of the total institutional budget, plus they repeated the process 519 times.

To see The Chronicle's impressive interactive infographic (try saying that five times fast) then follow this link to the chart, which also features a series of tabs that break universities down by category.

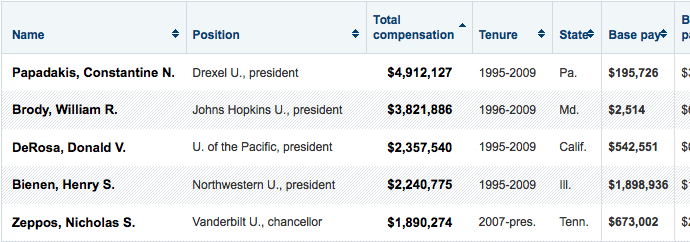
If you want to know whether the bigwig of your alma matter is in the 99% or 1% as it were, then we recommend purchasing a subscription to the Chronicle.  To whet your appetite, here's a peek at the tip-top of that compensation list.  (Tip:  They culled this salary data from the Guidestar website, which we have also blogged about before here.)

All The Money In The World...

Screen-shot-2011-11-25-at-1.02.45-AM.png

...has been visually distributed in one awesomely massive chart, courtesy of Randall Munroe's profoundly entertaining & enlightening web comic XKCD.  (That's your cue to bookmark it.) He says on the poster, "Nearly every amount has a cited source- when possible, a scholarly work or government publication," and- in a move that captures our librarian hearts- he offers a link to download the impressively long list of references here.

P.S.  This is not a poster for perusing on your smartphone.

P.P.S.  We hope you had a Thanksgiving holiday as happy and fullfeeling as ours!

A Study on Spending

RebateBonus.jpg

Once again academia has pretty much confirmed one of life’s truisms.  In the 2006 Journal of Behavioral Decision Making, authors Epley, Mak, and Idson, in an article titled "Bonus of Rebate?: The Impact of Income Framing on Spending and Saving," drew on previous research in mental budgeting & accounting, which has demonstrated that where our spending behavior can be predicated on which account we pull money from.  They took another step along this line of research and conducted four experiments, each of which supported their hypothesis that when we spend, we do so with a consideration of how we acquired that money to begin with. Basically, if we receive money that is presented to us in the form of a “bonus” to our absolute wealth, we are significantly more inclined to spend it than if we are told that the money is couched in the form a rebate, or “a return to a prior state” of our wealth.  This behavior, in their words, has important “ implications for the consumption of other commodities, assessments of risk, and government tax policies.”  For example, our government has in recent history (2001, 2009) given Americans rebate checks with the hope that Americans would spend them to stimulate the economy.  Unfortunately for those officials the numbers cited (at least for 2001) reflected that nearly only 22% of us spent that money, and as we know, we still have yet to recover lickety-split from 2009.

Casual Friday: Live Purchasing

mappos.jpg

In case you needed another way to spend your free time, here’s one interesting way: live purchasing.  The Zappos.com website has a Real-Time Order Map that it dubbed Mappos, which allows you to see what individuals (kept anonymous of course) are ordering in real time all over the country.  You gaze at a map of the U.S. as images of merchandise, pointing to an originating city, pop up on the screen for several seconds before winking out.  If you feel so inclined, you can even vote thumbs up/down on the merchandise that was purchased, though Zappos doesn’t detail how that feedback is used.  Not only is Mappos addictive to watch, but it arguably exemplifies the oldest selling ploy in the book, aka, “Everyone’s doing it.” They are not the only company to have employed technology to track live purchasing.  In an excellent Vogue article from the June 2010 issue called “High Clicks,” Sarah Mower interviewed Natalie Massenet, the founder of swanky luxury clothing etailer Net-a-Porter, a company which also tracked live purchasing behind the scenes, and presumably still does today.  Mower had the following to say about Net-a-Porter's live purchasing system:

“…The whole office is wired for sound and video. Everyone in the company here, in New York, and the distribution centers can see what's selling, when, where, what the turnover is. Go look at the screens.  They're mesmerizing.

Positioned in the sight lines of every desk, they display a visual of Google Earth, and every time someone makes a purchase, a Net-a-Porter bag pops up on the location. On the screen above, the shopper's order is pictured, along with how much she spent, where she lives, and a running tally of the day's takings. It's 11:00 A.M. London time now, and someone in Yekaterinburg, Russia, is buying towering $1,200 Fendi shoes. In NYC where it's 6:00 A.M. a woman drops $3,600 on Isabel Marant. A pair of $1,290 Bottega Veneta sandals is being ordered up in Athens (though the country's nearly bankrupt); a plunging, multicolored $600 Melissa Odabash swimsuit is going to soccer-wife country in Altrincham, Manchester.”

Needless to say, it seems that live purchasing could serve multiple functions, acting also as an ongoing morale-booster for employees who sell and process merchandise.  It will be interesting to see the extent to which this trend catches on and evolves in the future.

Who's Buying What Where

World_Spending1.jpg

Who's buying what? Find out with the Euromonitor International data visualization of world spending. The Who's Buying What? map provides the country's average spending per person on clothing, household goods,alcohol & tobacco, recreation, and electronics.

  • Norwegians spend by far the most on recreation - $4,242 per person per year - yes even more than the US!
  • In Brazil they spend the most on alcohol & tobacco
  • Pakistanis spend the least amount on recreation and electronics
  • People in Columbia and Indonesia spend most of the dollars on household goods

World Spending Map

St. Patrick's Day - Spending o' the Green

Four-Leaf_Clover.jpg

We may not all be Irish but that doesn't stop us from celebrating St. Patrick's Day. According to the National Retail Federation over half of Americans will take part in the holiday. That's 122 million people going to parties, decorating with four-leaf clovers, drinking green beer, and eating green mashed potatoes. Total spending for the green day is expected to reach $4.14 billion! My favorite St. Patrick's Day treat is the McDonald's Shamrock Shake. To learn more about the famous shake, including history, old ads, and nutritional facts (I'll warn you, you may not really want to know about that), check out the Ultimate McDonald's Shamrock Shake Guide. If you want to get yourself some of the minty goodness today, check out the Shamrock Shake Locator to see if they have been sighted  in your area.

St Patricks Day 2011 - How Consumers Plan to celebrate

Valentine’s Day Dollars

Valentine_Chocolates.jpg

Your sweetie might show be showing a little more love this Valentine's day. The National Retail Federation recent survey shows that after a couple of years of declining spending on the most romantic day of the year the love is back. Total spending should be up almost 13% over last year. Spending for the holiday is expected to reach $15.7 billion! With increases in all areas including jewelry, clothing, and dining out. The average per person is a whopping $116. Not surprisingly, the survey shows men spend twice as much as women, and young couples and parents who have to buy for school spend more than those 65+.

Retailers appreciate all the love in the air. “Jewelry, candy and apparel sales should provide a nice boost for retailers during the typically slower months of January and February,” said NRF President and CEO Matthew Shay. The big winners are the discount stores that see 36% of those shopping dollars. Department stores get a 30% share. Specialty stores and online retailers follow with 19% and 18%.

Happy Valentine's Day from bizologie! xoxo

How are folks spending their money?

Bundle.jpg

Need stats on how consumers are spending their hard earned dollars?  Or are you just curious how your personal spending stacks up to your neighbors? Bundle is the free resource that provides spending and saving data gathered from over 20 million Americans. The Everybody's Money feature lets you filter by income, age, household status, city (even down to the zip code level). You see bubbles for broad areas of spending and then Go Deep for more of a breakdown. Under Food & Drink you can see dining out spending separate from grocery store spending. Bundle even provides you with the names of the merchants most used by your select demographic for that area of spending. Then they give you monthly spend and even average purchase price!

How do they do it? The largest portion of the juicy information comes from anonymous and aggregated customer spending data from Citi and other third party providers. It is even updated quarterly so that you can see seasonal spending and spot trends early. Not only is it amazing data, it is also easy to use, and really pretty.